Does the PC power supply introduce harmonics into the power grid?
This is a continuation of the article: how much electricity a PC consumes during operation.
This time, an oscilloscope with a current pickup and a differential probe will be used to measure the voltage.
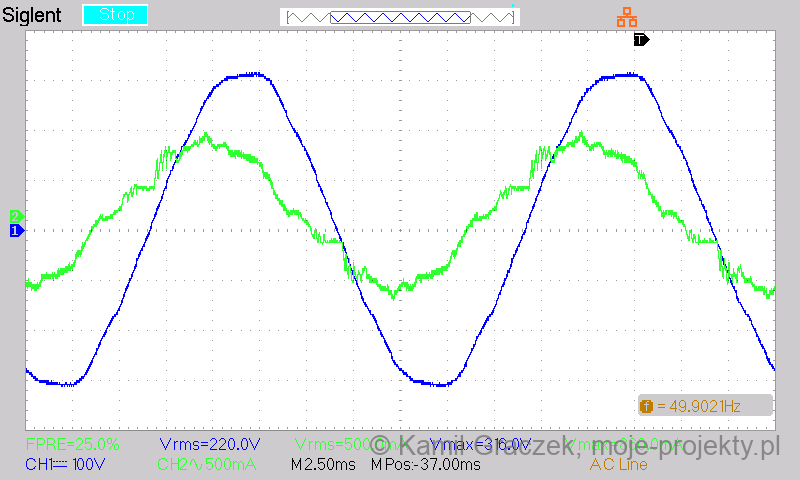
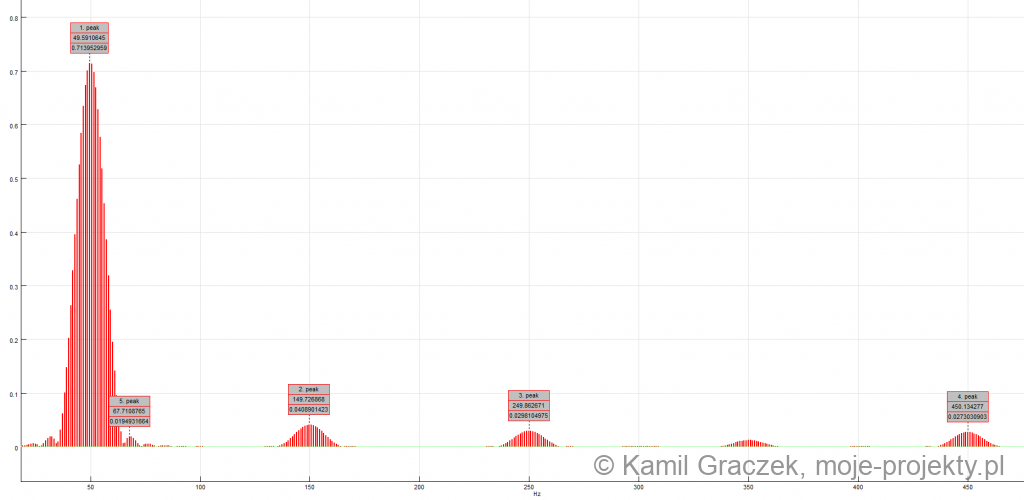
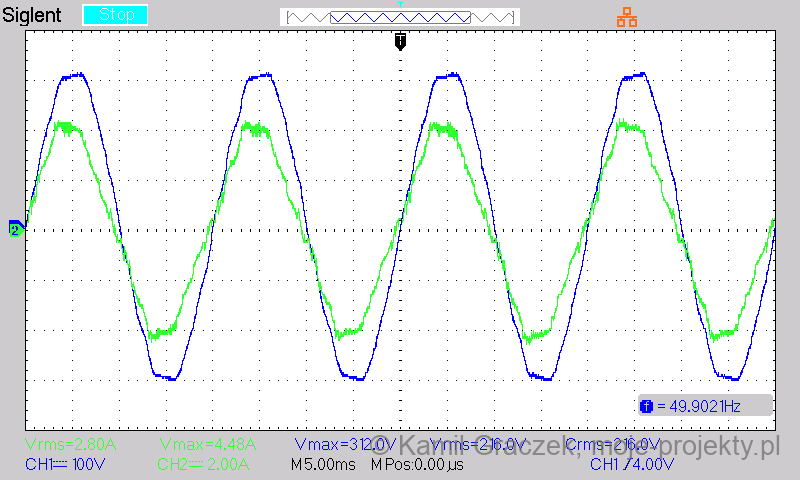
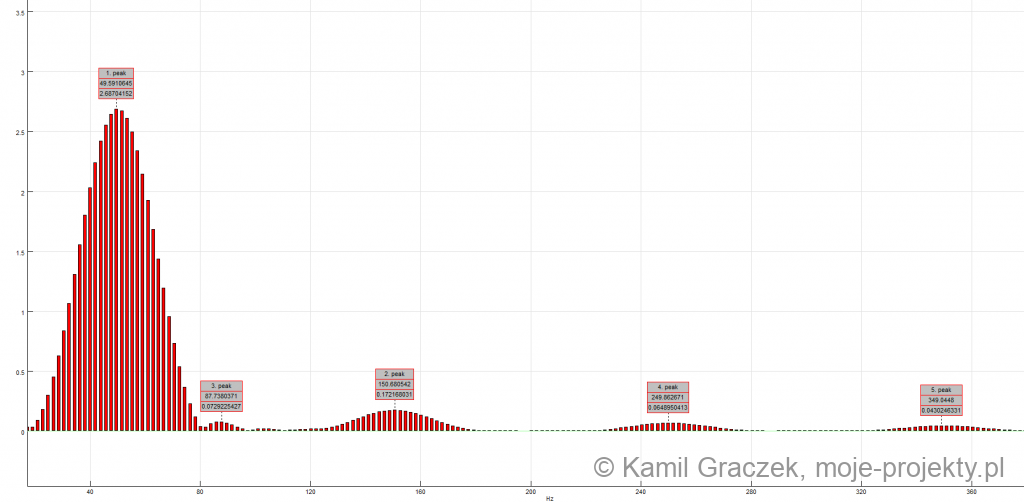
Two measurements were made, the first with the computer running without load, and then with the OCCT program load (in PSU testing mode). The measurements were saved in a .CSV sheet, and then, based on the collected data, an analysis of the harmonics contained in the waveform was performed.
Summary
The difference is significant to the disadvantage of the device without this system.
The course of the current drawn from the mains by the tested power supply can be considered as close to a sine wave, while the level of higher harmonics tested with the FFT Hann algorithm does not exceed 5%, which can be considered a good result.
Notes
Since the first article in this section was written, the configuration of the computer has changed.
The change that most affects the measurement results concerns the graphics card.
Previously it was: EVGA GeForce GTX670
Now it’s: ASUS Radeon RX580


